Inequality and Underserved Areas: A Spatial Analysis of Access to Public Schools in the Greater Cairo Region
Egyptian families spend a fortune on education. Although public schools are available to everyone, most families try to find private tutoring to supplement their children’s education in the public school system. According to the Household Income, Expenditure, and Consumption Survey (HIECS) 2012/2013, an average household devotes about 38% of its expenditures for education on private lessons and 11% for transportation. Teachers’ government salaries are notoriously low, matching the profession’s status in society. The quality of education in Egypt is a common complaint among residents, leaving families to struggle to ensure that their children get an education so that they may succeed. However, one complaint we sometimes hear in our research, particularly in informal areas, is that schools are too far away, placing a further burden on the family for transportation, as well as the children who have to endure unreasonably long commutes to school. Through our research at TADAMUN, we have anecdotal evidence that suggests this issue is particularly prevalent in informal areas. So, we decided to explore the spatial distribution of public schools within the Greater Cairo Region (GCR) and how this distribution relates to population and informal areas.
In the early 1990s, the Egyptian government signed a pledge to adopt the universal education reform agenda conceived at the Educational, Scientific and Cultural Organization’s World Conference on Education for All (EFA) in Jomtien, Thailand. The government dubbed the 1990s the “education decade.” However, the government’s priority for improving education was as much about human development as it was about national security. Also in the early 1990s, the government felt threatened by Islamist movements that originated in underserved neighborhoods of Egyptian cities where the government had little presence. In Cairo and Giza’s poorer neighborhoods, families turned to private lessons and private schools in the absence of government facilities. These private schools and lessons were typically offered by mosques or religiously oriented NGOs. However, the government believed that many of these schools and/or mosques were affiliated with Islamist movements and attracted members by offering free or reduced services, including education. The government thought it would be able to mitigate the threat, and at the same time, reach some of its national educational goals by building schools in these underserved neighborhoods to displace the religiously oriented institutions and pushing to raise primary school enrollments (Dixon, 2010).
The results of the “education decade” were, at face value, impressive. Between 1990 and 2005, both primary school enrollment rates and literacy rates of individuals between 15-24 years of age increased by 10 percent. However, the government has not invested enough in school facilities to keep pace with the demands of a growing population, particularly in informal areas, and, as a result, classrooms are overcrowded to a breaking point, teacher and administration development are not adequately addressed, and the quality of education in Egypt has not kept up with enrollments.
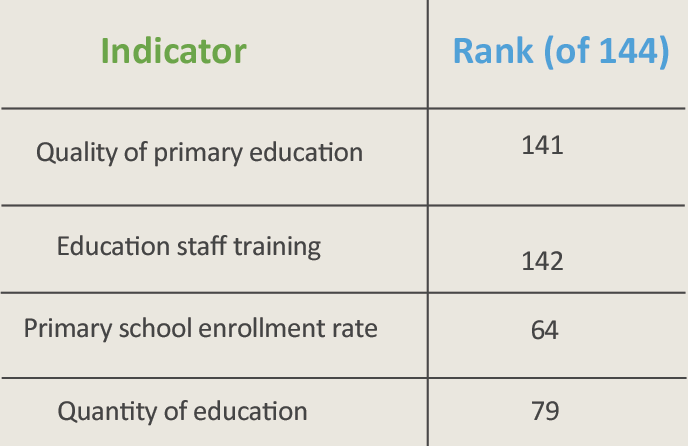
A recent survey by CARE Egypt found illiteracy in some schools as high as 80 percent. In the 2014 – 2015 Global Competitiveness Report from the World Economic Forum, a survey of the set of institutions, policies, and factors that determine the level of productivity of a country, Egypt ranked 141st out of 144 countries in terms of quality of primary education and 142nd in education staff training. This is in stark contrast to enrollment rates, which reached 95 percent for primary school children, good enough to place Egypt 64th, and quantity of education, where Egypt placed 79th on the Global Competitiveness Report (World Economic Forum, 2014).
While there are several major challenges facing the education sector in Egypt, one not often discussed is access to schools and the spatial equality of the distribution of schools. How easily can children get to school and how much do families have to pay to get them there? Two of the primary reasons why children drop out of school are because of poverty, either because their family cannot afford it or the family depends on the child’s wages and employment, or the distance students must travel to school.
Public schools serve students that live in the surrounding neighborhood. They are inherently community institutions. Public schools should be relatively evenly distributed throughout the city in proportion to the population of areas to ensure equal access to education. Most families in the Greater Cairo Region do not own a car and to get to school, students must take public transportation, a taxi, a tuk-tuk, or walk — Cairo’s most common form of transportation. The further families with school-aged children live from school, the more they have to spend on transportation or the greater stress on the students due to travel time to and from school. According to the HIECS 2012/2013, families spend approximately 11 percent of their education budget on transportation alone. If families live within walking distance of their school, then the cost of transportation falls to zero and the stress students experience traveling is reduced.
What is walking distance? There is no agreed upon definition for the phrase, but for the purposes of this study, we define walking distance as 1 kilometer.
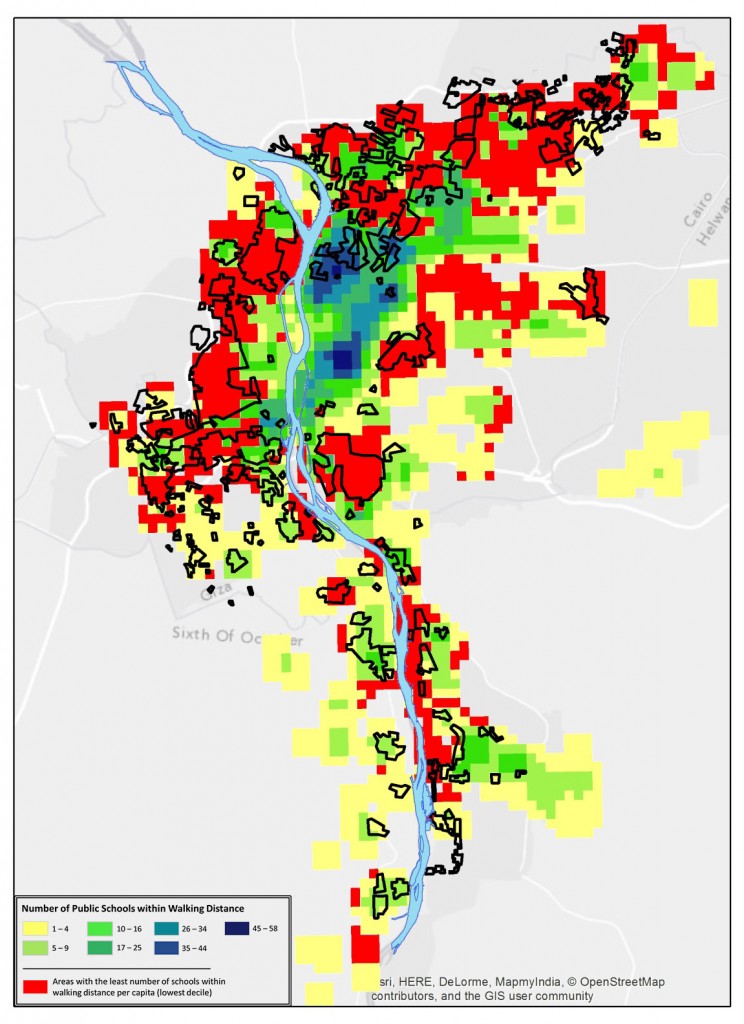
Which neighborhoods in the Great Cairo Region have the most public schools within walking distance? The following map answers that question. The areas in blue have the greatest concentration of schools within walking distance, and the areas in yellow have the least concentration of schools within walking distance and the green, somewhere in the middle. The areas with no color have no schools within walking distance. For more details on how we defined the study area, how we created the map, and the data we used to do so, please see the methodology. Also, we wanted to do this analysis on the entire Greater Cairo Region, but the available data presented some limitations.
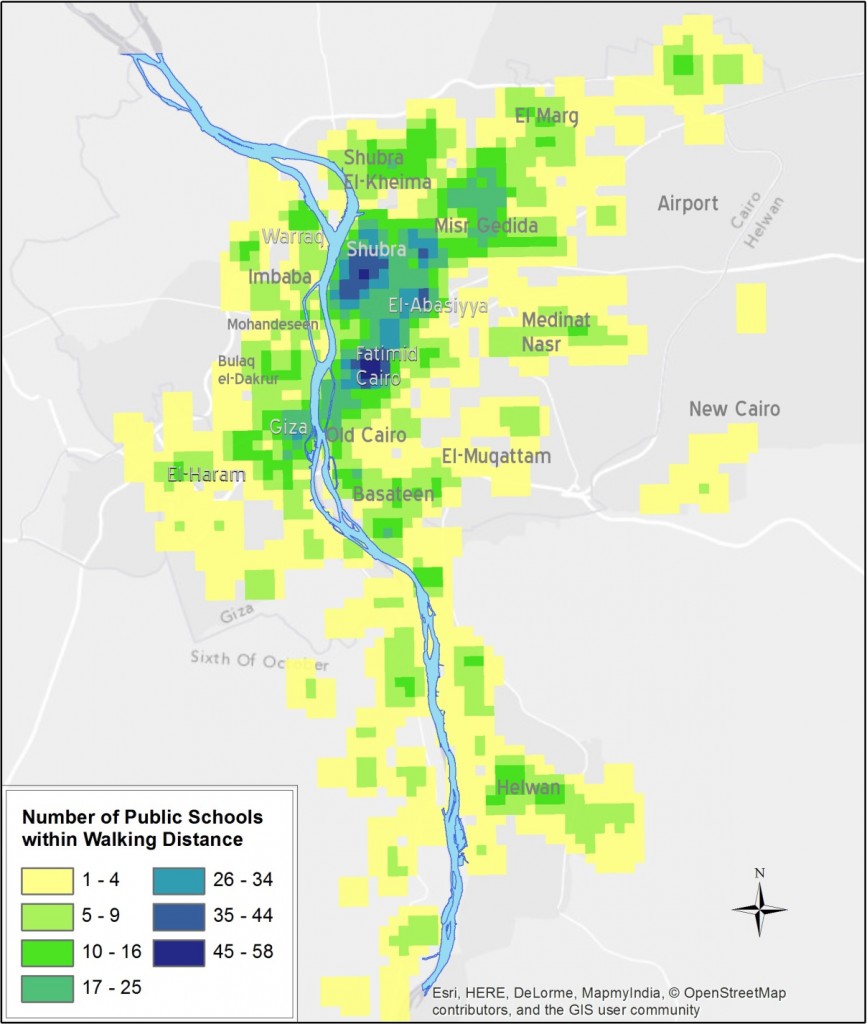
Number of Public Schools within Walking Distance in the Greater Cairo Region, 2006. (Source: CAPMAS)
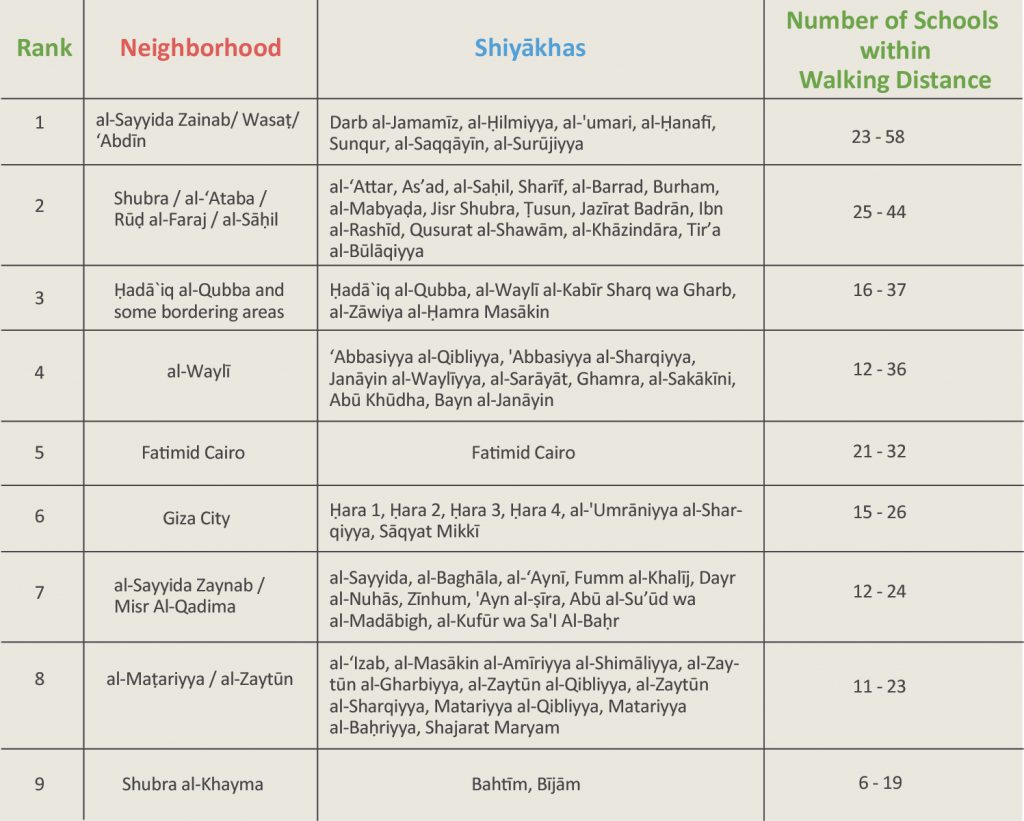
There are four neighborhoods that immediately stand out as areas with a very high number of schools within walking distance: Fatimid Cairo, Shubra, Al-‘Abasiyya, and Ḥada’iq Al-Qubba. Within each of these neighborhoods, there are areas within walking distance of 32 or more public schools. The average number of schools within the entire study area (see the methodology for a description of the study area) is just over six. Why are there so many schools in these neighborhoods? These are some of the oldest parts of the city. The scale and pattern of the urban fabric in these areas cannot accommodate large schools; many existing buildings have been repurposed for educational purposes. Although we do not have enrollment data for each of the schools in these neighborhoods, we assume that each school in these areas has far fewer students than public schools in newer parts of the city, and they serve smaller populations as evinced below.
The relatively low number of schools within walking distance of areas such as Madinat Nasr, Misr Al-Gadīda, Zamalik and other higher-income neighborhoods is likely because these neighborhoods are largely served by private schools (which are not included in this map). There are also relatively few schools within walking distance in informal areas, but the true disparity in access to public schools can only be demonstrated when taking into account population.
Areas with the Greatest Number of Schools within Walking Distance
This map shows the population density of the study area with informal areas outlined in black. The darker blue regions have higher densities and the lighter blue areas have lower densities. The maps show the density as persons per quarter square kilometer. Although this is not a typical measure of density, the quarter square kilometer is the unit of measurement used in the analysis below that correlates with our definition of walking distance. Please see the methodology for more details. The chart below lists density in both quarter square kilometers and the more traditional square kilometer.
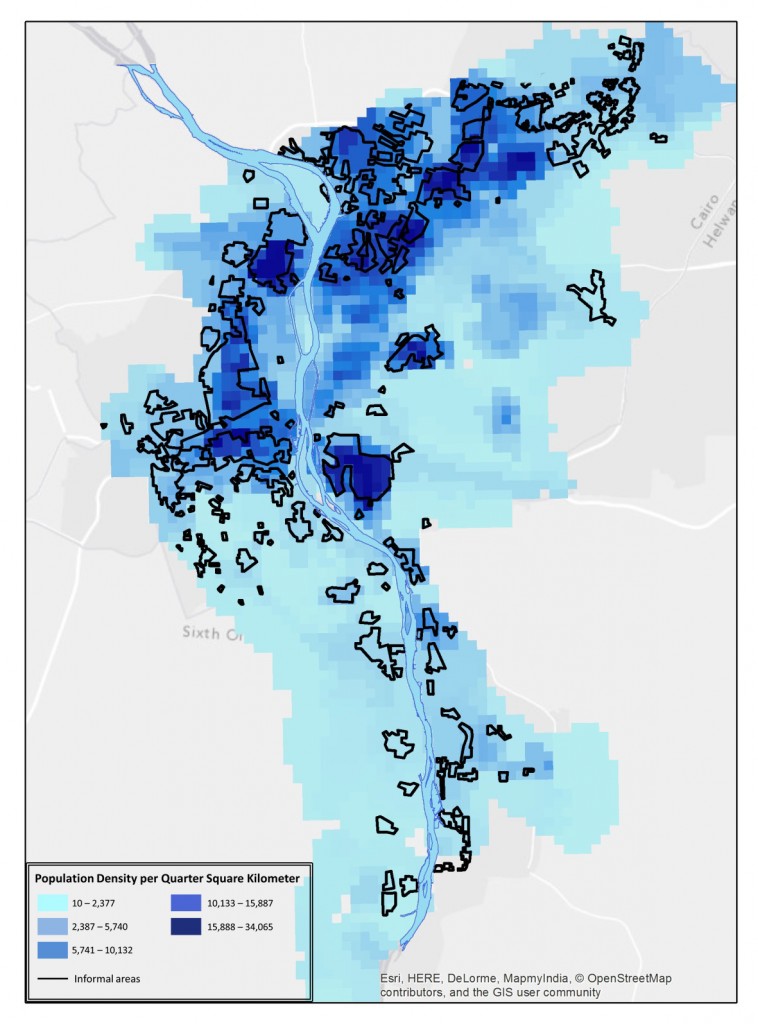
Population Density in the Greater Cairo Region, 2006. (Source: Population data, CAPMAS 2006 Census; Informal Areas, GIZ)
The densest parts of the city are mostly informal areas. Imbaba/Warraq (in northern Giza city), Dar al-Salām/Basātīn (in southern Cairo), and Al-Kunayyisa (in Al-‘Umrāniyya district in southern Giza) are by far the densest neighborhoods in the region, with densities upwards of 100,000 people per square kilometer.
The Densest Neighborhood Groups in the Study Area
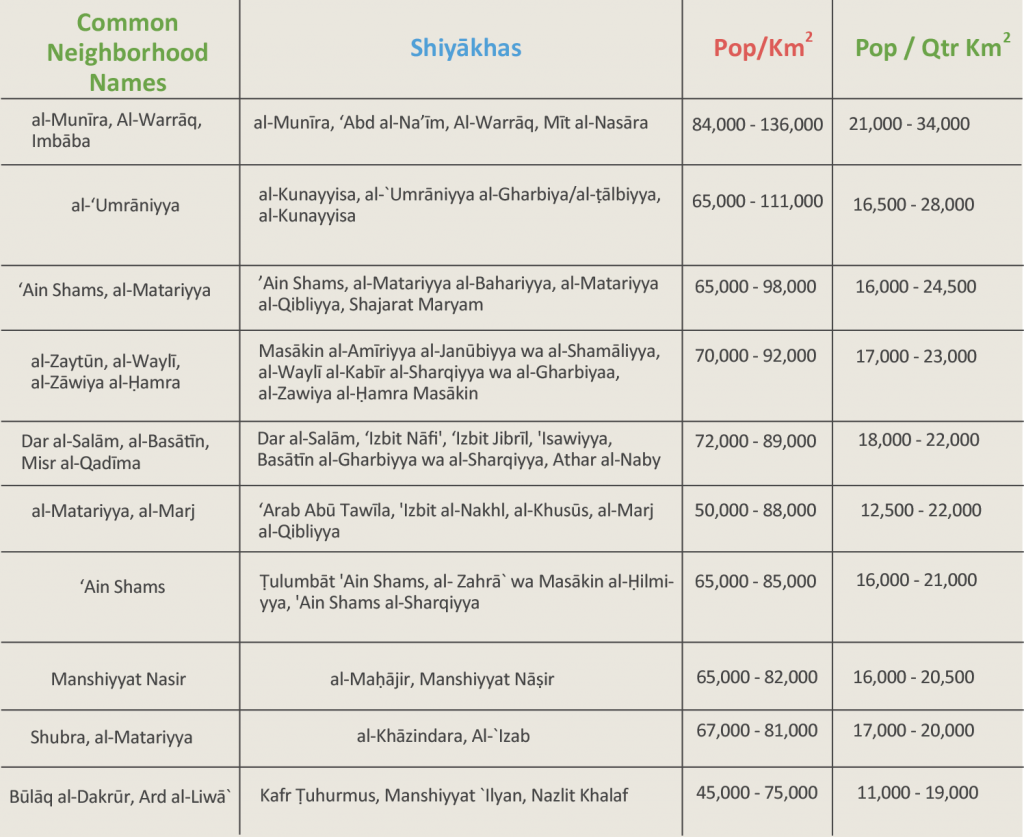
Source: CAPMAS 2006, Estimates by Tadamun
When these two maps are combined—population density with the number of schools within walking distance—the results confirm much of what anecdotal evidence may suggest: informal areas are hugely underserved with very few schools within walking distance per capita.
This map shows, in red, the areas that are in the lowest ten percent of all areas in the study area in terms of number of schools within walking distance per capita. In other words, these areas are the least served areas of the region.
What do some of these neighborhoods look like up close? The neighborhood of Al-Munīra in Giza, just west of Imbāba and south of Al-Warrāq, is the least well-served neighborhood in the Greater Cairo region. It is also among the most densely populated with densities upwards of 130,000 people per square kilometer. Ironically, it was this part of the city that experienced some of the most violent manifestations of Islamist movements in the early 1990s, yet, according to the data that we have, the government has hardly built any schools in the area at all. Here is a satellite image with the location of public schools in green.
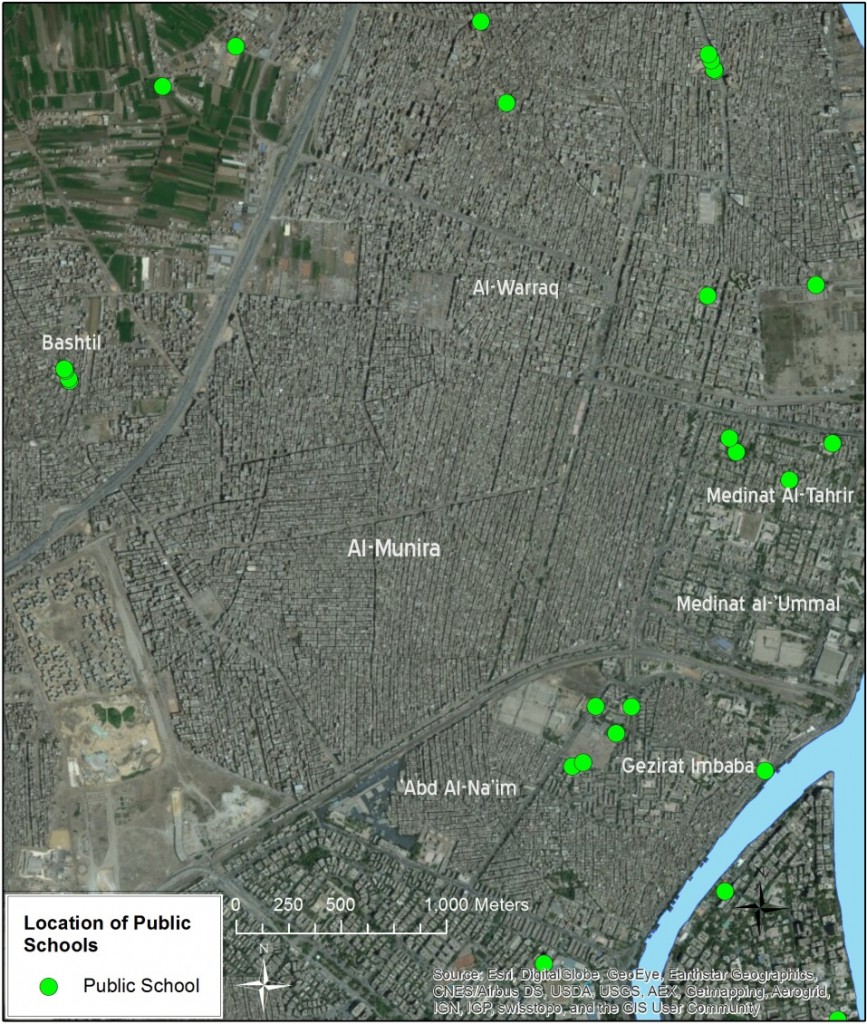
Location of Public Schools in Al-Munīra / Imbāba / Al-Warrāq (Source: Public school locations – GOPP)
Another extremely dense, highly underserved area in the GCR is in the Dar Al-Salām / ‘Izbit Nāfi’ / Wist Basātīn region. Here is a satellite image of that area.
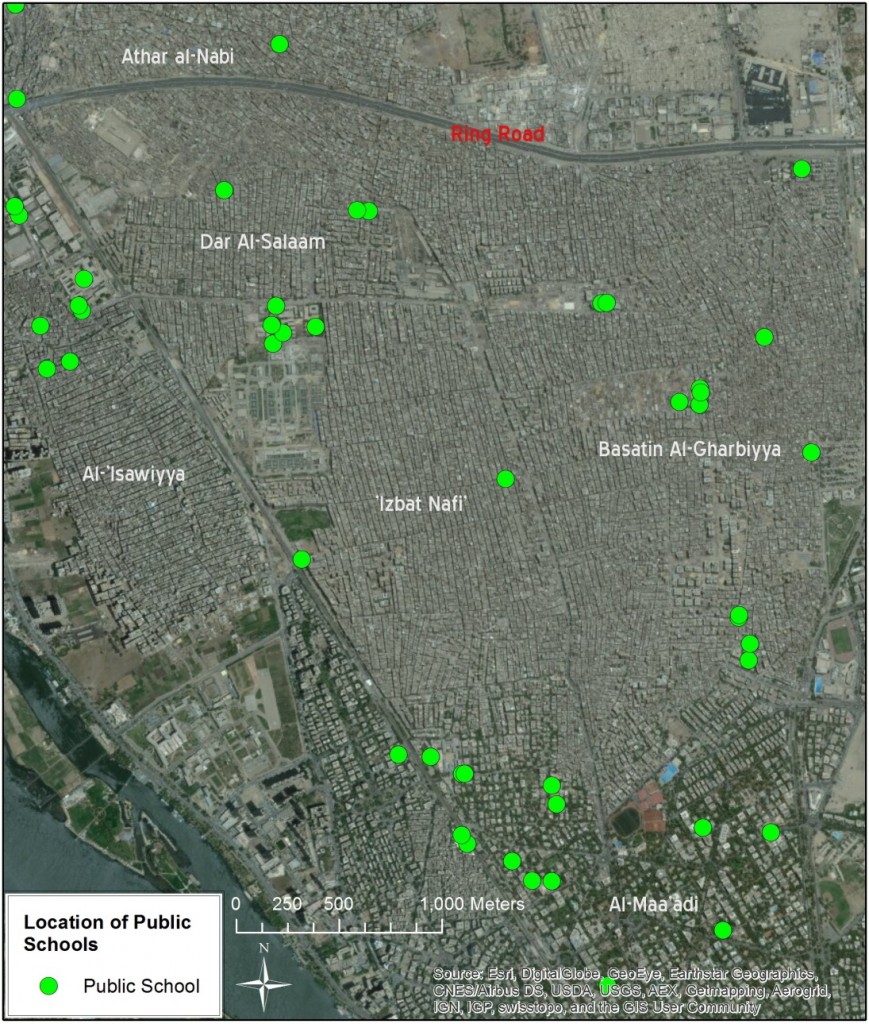
Location of Public Schools in ‘Izbit Nāfi’ / Dar Al-Salām / Wist Basātīn. (Source: Public school locations – GOPP)
Part of the issue of walkability is the uneven distribution of public schools throughout informal areas. As the above satellite images suggest, public schools are clustered in and around certain areas of informal settlements, leaving large stretches of the areas without even access. Although more research is necessary to draw a definitive conclusion, this may be, in part, due to the government’s reactive approach towards informal areas where they provide public services (including schools) to these areas after the areas have already been built and populated. This forces the government to take a practical approach to building schools, siting them wherever land is available, rather than siting them in areas where the residents in need would have the most access. These land limitations limit the options for where public schools can be located within the area, presenting hardships of access to students and residents as a whole. To avoid this problem, the government needs to be more proactive in its land use management approach to informal areas, by anticipating future growth and designating land to build public schools or other public service buildings.
Conclusion
This is a preliminary look at the distribution of public schools throughout the Greater Cairo Region and although the results are rough estimates, they suggest that the government needs to seriously address issues of accessibility to public schools for children living in informal areas. These are Cairo’s most disadvantaged children who face overwhelming obstacles in their lifetimes simply because of the place where they were born. People who live in different areas have different levels of access to education, access to work, and access to rights and this structural disadvantage persists across generations. Getting to school should not be one of these obstacles. Given the extreme importance Egyptians place on education, if these children do not have access to public schools (and this is not even touching on the quality of education delivered at these schools), then what chance will they have of overcoming the societal structures that leave them disadvantaged in the first place?
Methodology
The Data
We created the maps using three sets of data: population data from the 2006 Census, shiyākha (neighborhood) boundary lines obtained from a colleague based on the maps published by the Cairo, Giza, and Qalyūbiyya governorates (these are not official maps—official maps in a format useable in ArcGIS are not publicly available), and a point data set from GOPP (General Office of Physical Planning) which includes the location of all public, private, and special needs schools as well as universities, technical institutes, and other training centers. The boundary of the informal areas were created by the GIZ (Deutsche Gesellschaft für Internationale Zusammenarbeit).
We recognize that some scholars have questioned the census results regarding informal areas, suggesting that these areas are severely undercounted. However, we did not adjust any population figures based on community, non-governmental organization, or other unofficial population estimates. This would suggest that children living in informal areas are likely even more underserved that the data above demonstrates.
As mentioned above, the boundary maps on which densities are calculated are unofficial. All of the density measures included in this article should be seen as an estimate only. We adjusted only one of the density figures for ‘Izbit Nāfi’ and its surrounding area. In the original calculation, the densities came out to well over 250,000 people per square kilometer—well over eight standard deviations from the population density mean in the city, and more than double the densities of adjacent neighborhoods despite a relatively consistent urban fabric, typical of informal areas in Cairo. To adjust the densities of ‘Izbit Nāfi’ and its surrounding neighborhoods, we averaged the densities of the surrounding neighborhoods and reapplied the densities to our data set to fall within a more realistic range.
As for the point data set from the GOPP, we used only the public schools in our analysis. The point data set does not have a date associated with it, but it appears to be from the mid-to-late 2000s based on the presence of some schools built in the last ten years and the absence of those built within the last five. There were some flaws with the data, including well over a thousand duplicate data points as well as misplaced data points. The duplicate points were removed, and to the extent possible, the data points were cross checked against satellite imagery and adjusted when it was abundantly apparent that the point was misplaced. Otherwise, they were left alone. There was also some miscategorization of public and private schools, although we did not attempt to rectify this, assuming that the errors of labeling public schools as private and private schools as public is roughly equal—statistically, these errors should cancel one another out.
Even with the flaws in the data, we are confident that this analysis, while it may lack precision, is broadly representative of the spatial implications of school service provision in the study area.
Please note that the maps included in this article were created using ArcGIS 10.1.
The Study Area
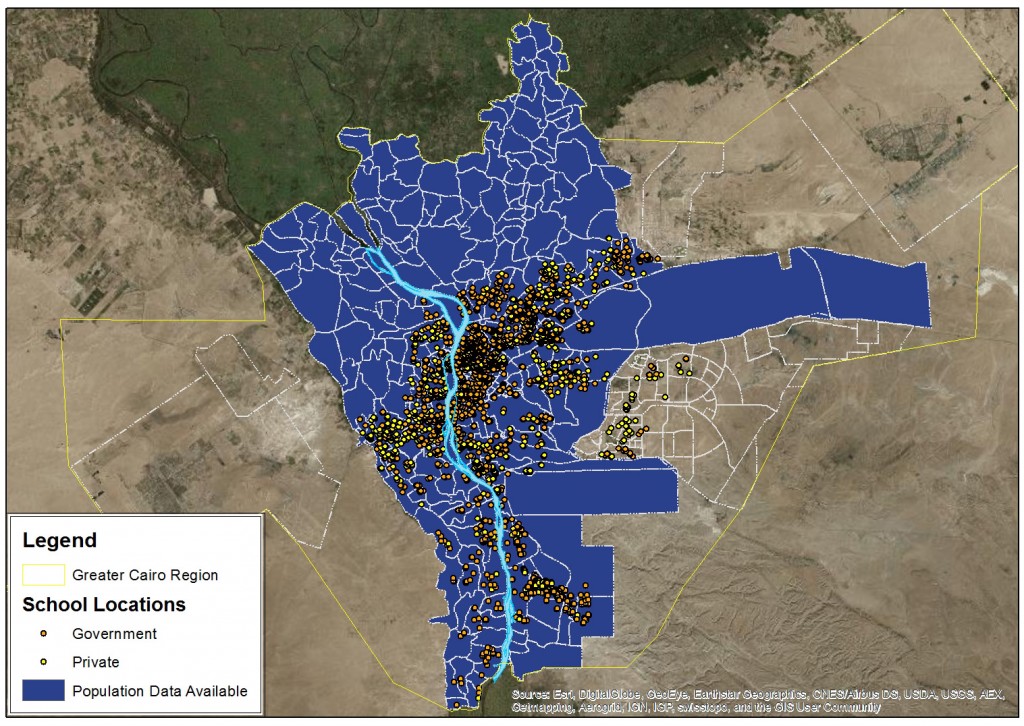
The original intent of this research was to conduct this analysis on the full Greater Cairo Region, but the study area was limited by both the available population data set and the point data set. This map shows the Greater Cairo Region outlined in yellow, the areas for which we have population data in blue, and the point data set in orange and yellow.
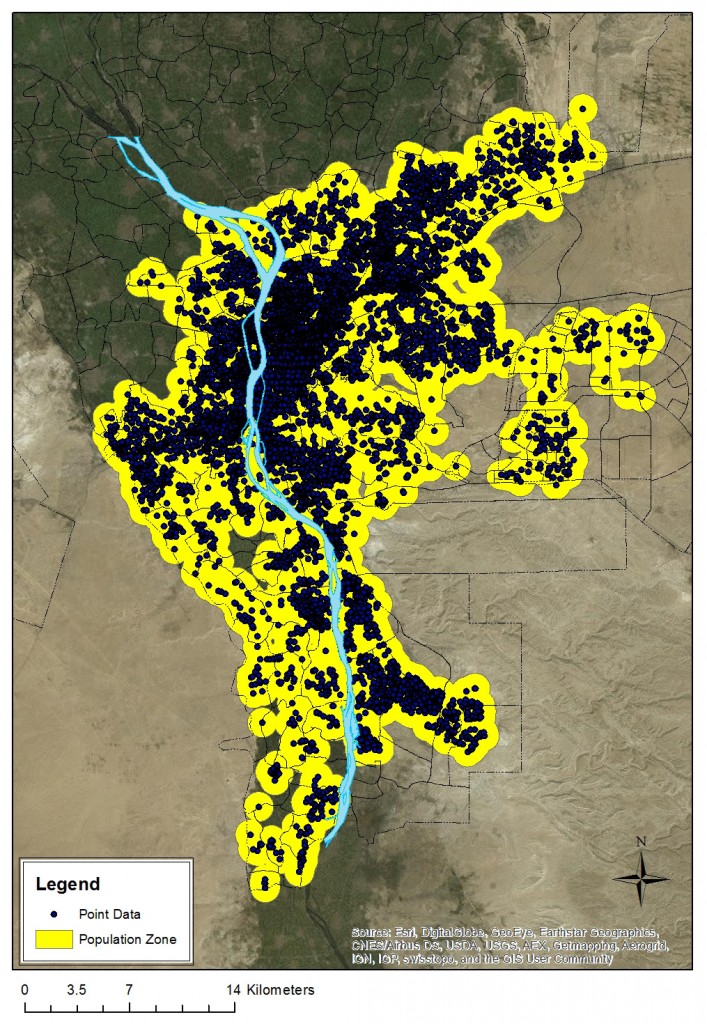
We first limited the shiyākhas (neighborhoods) by including those that contained a school or were adjacent to a school. In order to solve the issue of misrepresented densities of some neighborhoods, particularly those with a great deal of desert or agricultural land, we created a 1 kilometer buffer around all of the data points we had as well as a data set including mosques and churches and limited the extent of the shiyākha boundaries included in the study area to this buffer area. This assumes that everyone in the region lives within 1 kilometer of a mosque, a church, or a school. Using this buffer area allows us to effectively eliminating empty space from the analysis.
Walking Distance
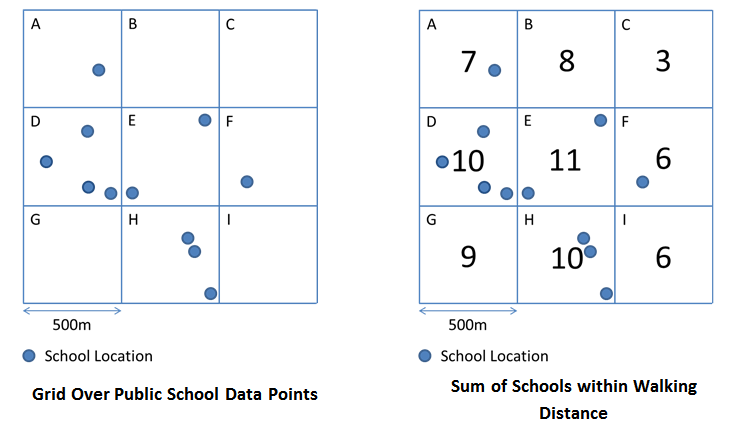
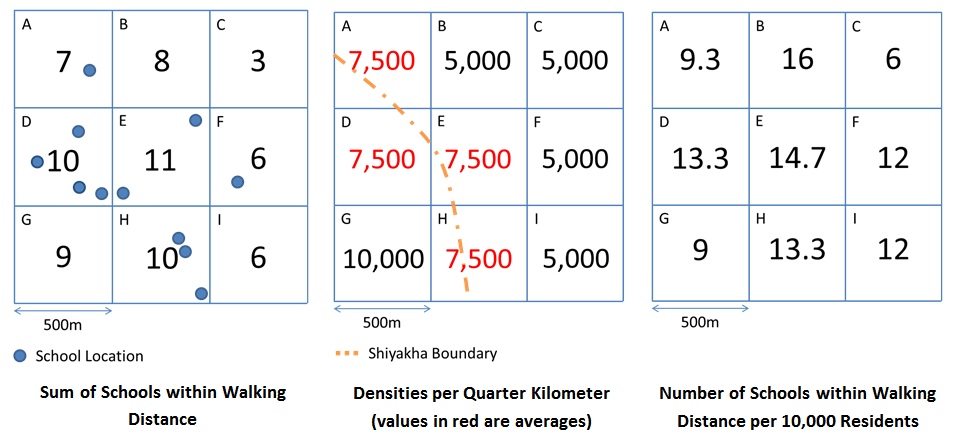
We define walking distance as 0.5 km to 1 km. In order to determine the number of schools within walking distance of a given area, we conducted a raster analysis by dividing the study area into a grid and set the length and width of each cell to 500 meters. By overlaying the grid on the point data set, we were able to count the number of public schools in each of the cells. We then summed the school count of each cell with the surrounding eight cells to assign a value of schools within walking distance.
In the pictures below, there are eleven schools as indicated by the blue dots. Cell A, for example, has one school in it, plus six other schools in the adjacent cells, for a total of seven. Cell E contains two schools and the eight adjacent cells have nine, for a total count of eleven. This was done for every cell throughout the study area. It is important to remember that the number of schools within walking distance score assigned to each cell is not just the number of schools within the cell itself, but also the schools in the surrounding (focal) area.
Density
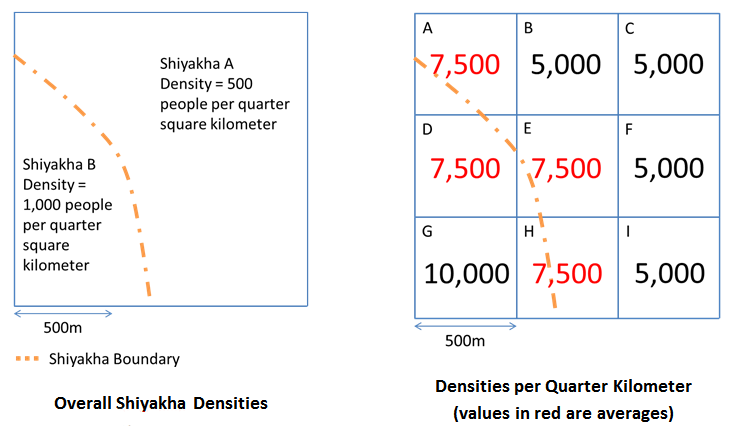
To create the density map, we assigned a density value for each cell in the quarter square kilometer blocks. The density values are based on the densities of each of the shiyākhas which are based on the population figures from the 2006 Census. We overlaid the grid on the shiyākhas. For cells entirely within the boundary of a shiyākha, we assigned that cell the overall density value of the shiyākha. For cells that are divided by two or more shiyākha borders, we averaged the values from each and assigned that value to the cell. These values are show in red in the drawings below.
At this point, each 500m x 500m square is assigned two values: the number of schools within walking distance and the density of the area. We then divided the number of schools within walking distance by the population density to derive the number of schools within walking distance per capita. The illustration below shows the number of schools within walking distance per 10,000 residents. The example is illustrative and by no means represents results in the study itself.
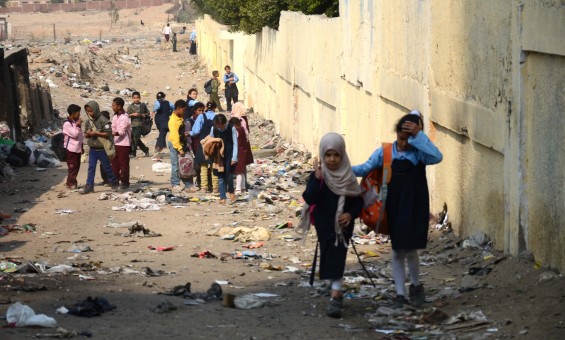
Featured Image: Adjacent street to Salah al-Din School, ‘Izbit Al-Haggana /Takween ICD. Used with permission.



Comments