Mapping Urbanism: Where Does it Lead?
Across cities, neighborhoods, and regions, inequity can grow when the economy shifts, resources relocate, government policies change, and opportunities migrate. Groups that prosper move on to greener pastures and others are left behind, ignored or unnoticed.
Redressing inequities is almost universally stated as public policy, or a goal of many activists, but often words are not matched with deeds. Affluent neighborhoods tend to have better schooling and health services; tourist areas have regular garbage collection; and neighborhoods where high-level government officials and diplomats live are invariably well-endowed with water, electricity, and sewage systems, even in cities were poverty and a lack of resources are common.
One way to reverse this trend is to provide better information about existing inequities, their intensity, and their location. Using official data, business data, and other material, including the first-hand compilation of community-based information, researchers are bringing new insight into the scene.
Geographic information system (GIS) tools now allow researchers to map out the distribution of municipal services in a certain city or region, thus offering the general public a way to understand inequality and giving policymakers some incentive to act.
In reviewing a few cases of mapping worldwide, we will attempt to evaluate the impact of mapping on public policy, assess the opportunities it offers, and highlight some of the constraints it presents. The following examples, drawn from three continents, may help illustrate the manner in which mapping can offer insight into crucial problems and help bolster citizens’ claims to shelter, to clean air and water, and to education and health, all of which are integral parts of the Right to the City.1
I.Spatial Injustice in the Greater Cairo Region
Since 2011, the research and public policy initiative, TADAMUN, has been examining the issue of social justice and the built environment and part of our concern lies within the question of inequality and how it is manifested spatially. Does the government allocate public services fairly; namely, giving priority to those neighborhoods with the most difficult challenges of poverty, inadequate housing, unsafe areas, and few public resources (education, healthcare, transportation, water, gas, or electricity). In the course of its work, TADAMUN identified several areas where the allocation of resources was mismatched with needs.
For example, while the 2014/2015 budget for the Informal Settlement Development Facility (ISDF) – the entity responsible for upgrading Egypt’s ashwa’iyaat – was EGP 609 million, the budget for the New Urban Communities Authority – the entity responsible for building Egypt’s new desert cities – for that same year was EGP 37 billion (MoF, 2014).
The mismatch of resources and needs is all too evident here. Nearly 16 million people live in the ashwa’iyaat across Egypt (ISDF, 2010), compared with 5.3 million people in the new urban communities (NUCA, 2015), and yet money spent on the latter is 60 times bigger than the former. Granted, one must take into consideration the different tasks of the two entities given that the ISDF is responsible for upgrading existing areas while NUCA is building cities from scratch, including constructing services and utility networks. However, such a wide gap between the two can shed some light on the direction in which government priorities have been going.
In “Planning [in]Justice,” one of TADAMUN’s key projects, our researchers have gathered and analyzed information about inequalities in the distribution of public resources among various urban areas. Subsequently, they prepared poverty maps of the Greater Cairo Region (GCR), thus further illustrating the inequalities and clarifying their spatial dimension to government, business, and advocacy groups.
The spatial representation that TADAMUN prepared was so detailed that it highlighted the inequity parameters of one of Egypt’s small urban units, the shiyakah (an urban sub-district), that government statistics usually ignore.
Having published a series of maps for the GCR illustrating the spatial distribution of inequity parameters (schooling, income, health, etc.), TADAMUN also continues to work with other groups involved in the collection and dissemination of data to improve the quality and accessibility of such information.
Some of the most interesting facts that came to light through our work are:
- The actual distribution of poverty in Cairo does not match the common impression among officials and observers. For example, the concentration of poverty is not confined to the informal areas in the city. In fact, some informal areas enjoy a higher income than other formal parts of the city.
- Access to water is fairly good in most areas of the GCR. It is the quality of drinking water that is the problem.
- Sewage services are inadequate in the southern and northern parts of the GCR, forcing many communities rely on septic tanks, which are problematic for the environment.
- Access to schooling is skewed, as new schools are often built in areas that already have schools, and areas that are most in need of schools continue to be underserved.
- Expenditure on local development projects is skewed, with investment usually at its lowest in the neediest parts of the GCR.
II.Baltimore’s homelessness
Questions of inequality are not confined to developing countries, such as Egypt. In the United States, for example, homelessness is a serious issue in many major cities. One of those cities, Baltimore, has a program to alleviate this problem.
In 2009, the city of Baltimore (in the state of Maryland) launched a 10-year program that utilized mapping technology to alleviate homelessness. The city consulted researchers at Morgan State University in Baltimore to determine whether an existing warehouse could be converted into a permanent Housing Resource Center and emergency shelter, a move aimed to alleviate some of the problems of homeless individuals (Loubert 2010).
These researchers collected information from key stakeholders – homeless individuals, businesses, service providers, and residents – to map out the potential impact of a Housing Resource Center, with emergency shelter services and an array of supportive services (health, counseling, and employment). Using tools developed by ArcGIS, a cloud-based mapping platform, they plotted mobility patterns of the homeless and drew on demographic data from the U.S. Census to create a representation of the areas they selected for analysis.
Researchers also used ArcGIS tools to geocode 911 calls and compile crime data from the targeted area. Using the years 2004 and 2008 for analysis of crime and emergency medical services data, researchers concluded that an influx of homeless people to the proposed site would not increase crime, and it would provide desperately needed housing for this population (Loubert 2010). After securing housing, the city could then address various common problems among the homeless population such as healthcare, mental health issues, and unemployment.
While at it, the researchers also contacted developers of buildings for homeless people and solicited design ideas that would incorporate safety measures for shelter residents and residents of the surrounding community, as well as appropriate architectural designs for the area.
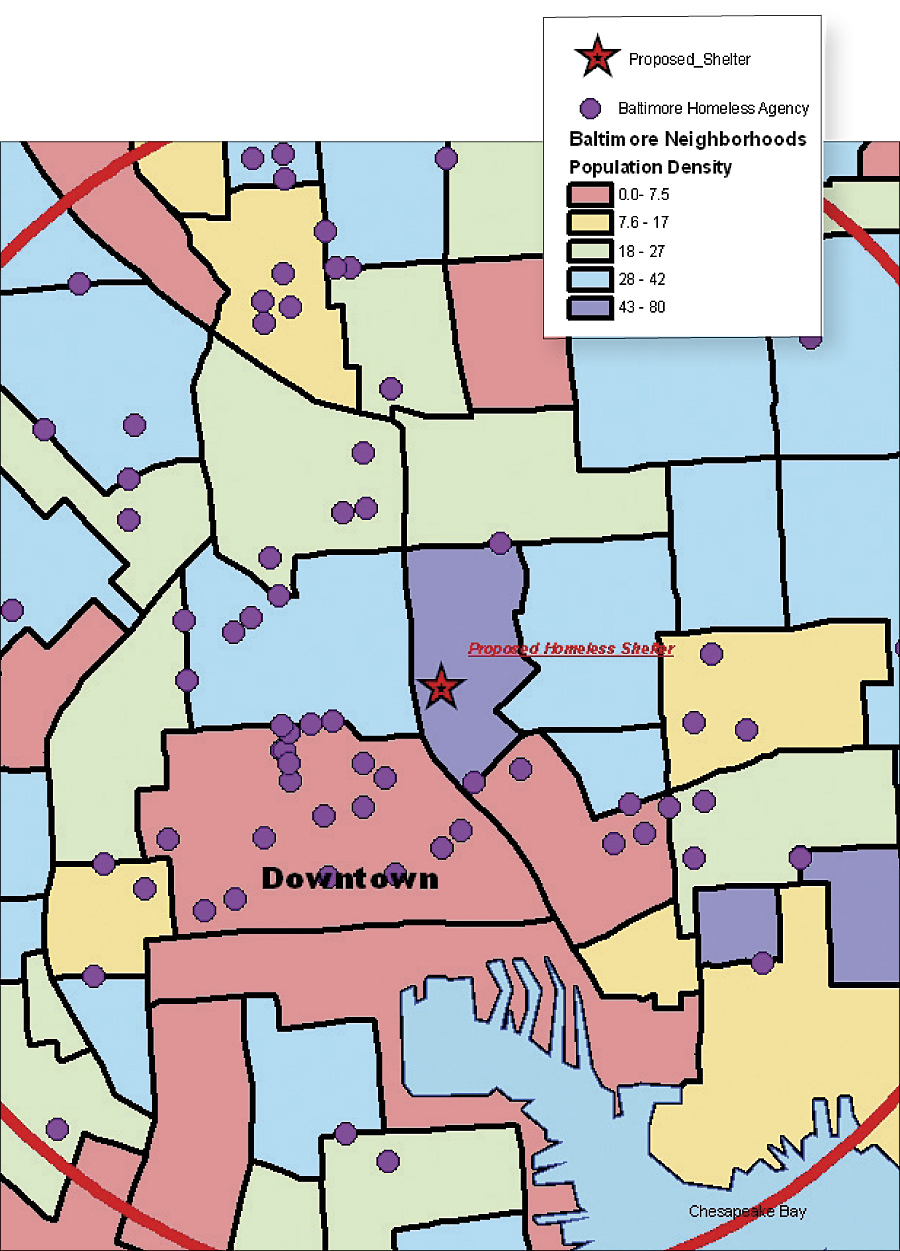
After this multi-faceted mapping process and data analysis, researchers concluded that the proposed site would be in an unpopulated area of a few blocks within a densely populated neighborhood that included some businesses.

Map showing the population density for defined neighborhood boundaries and locations of current service providers to the homeless within a 1.5-mile radius of proposed shelter.
Source: www.esri.com
III.China’s pollution
Until the summer of 2009, a tannery on the outskirts of Shanghai had been polluting the air and dumping wastewater into a nearby waterway.
The facility, operated by the Fuguo company in Shanghai’s Dachang district, processed leather used in hiking boots for the outdoors retailer Timberland, among other products. This was, needless to say, at odds with Timberland’s catalog image of blue skies and clear rivers and hikers frolicking in the pristine wilderness (Larson 2010).
Then the unexpected happened. In September 2009, the factory operator invited members of the community to a meeting inside the factory, where residents, local media, and Timberland representatives gathered to discuss the problem.
Fuguo’s officials listened to complaints and promised to take action. In April 2010, a third-party auditor inspected the facility, and local environmental groups and community members were able to confirm that corrective action was taken to reduce emissions.
The man responsible for this development was Ma Jun, a former journalist, who in 2006 founded the Institute for Public and Environmental Affairs (IPE), a member of the Green Choice Alliance.
In Ma’s office in Beijing, researchers compiled database records, reviewed documentation of factories’ environmental audits, and kept track of violations. They examined pollution records that were made available by local environmental protection bureaus, printed in state-run newspapers, or discovered from other sources. The group’s database now includes some 70,000 records of factories violating the law.
“We cannot fight with slogans or poems,” Ma told Christina Larson, a Beijing-based journalist. “We must fight with data” (Larson 2010).
What made Ma’s campaign possible is that China has in recent years agreed to publicize its environmental records. Although access to such information remains incomplete and lacks, uniformity researchers are happy to use what they can get.
China’s first environmental agency, modeled somewhat after the U.S. Environmental Protection Agency (EPA), was created in 1993, one year after the Rio Earth Summit.
As of May 2008, local environmental protection departments were required to make available to the certain public categories of pollution records.
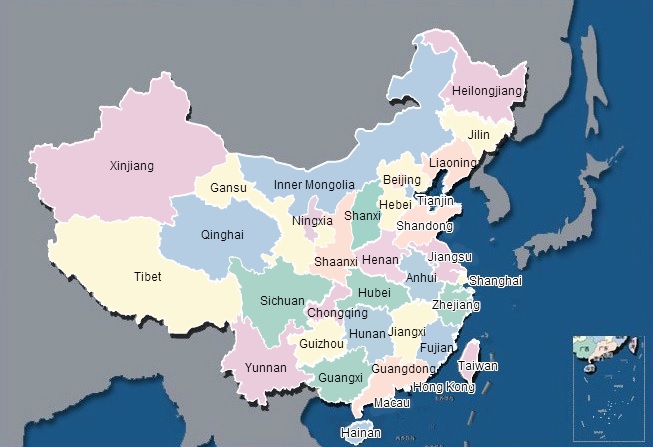
Using available information, Ma’s team created a series of free public databases, the most prominent known as the China Water Pollution Map which has had a significant impact on raising awareness about environmental problems (Larson 2010).

Online map, published by the Beijing-based Institute of Public and Environmental Affairs, run by Ma Jun, shows water quality and pollution across China.
Source: www.ipe.org.cn
Benefits of mapping
In the case of Baltimore, the researchers took action to help the city by studying the area surrounding a warehouse to determine its suitability as a permanent Housing Resource Center. The initiative came from the city, and the research team stepped in to propose various solutions, using the best GIS mapping tools available at the time and making the analysis public.
In the case of China, a legal change allowed the dissemination of environmental data. Ma and other activists took this opportunity and used data as a weapon (“we fight with data!”) to put pressure on government/business to clean up the environment.
In the case of Egypt, and the Greater Cairo Region, more specifically, the government has collected ample data, but the manner of collection and presentation has impeded the data’s usefulness in policymaking. The TADAMUN team reassembled, repackaged, and complemented the data about urban inequality in order to create a more precise targeting tool for alleviating poverty and distributing public services and resources more fairly, where the needs are the greatest.
One of the key findings of TADAMUN’s research is that contrary to conventional wisdom, it is not that the government always lacks the financial resources to solve Cairo’s problems, but that government funding is typically skewed in favor of distant new cities that are shunned by the poor due to the lack of transit and jobs.
The TADAMUN findings seem to support the claim that decision-making related to urban inequity should be made in consultation with the local population in specific neighborhoods, rather than in a top-down manner by urban officialdom who envision policy at the central, rather than the shiyakha or sub-district, neighborhood level.
Caveats and concerns
Although officials in government and the private sector have a lot to learn from mapping, there is no guarantee that they would be prepared to change their ideas or perceptions. In other words, mapping can offer insight about ‘who needs what and where,’ but it is no guarantee for corrective action.
In Cairo’s case, the impact of mapping inequality is still unclear. In private conversations with government officials, senior TADAMUN researchers noticed that some officials were particularly appreciative of the new information, while others remained more comfortable with the traditional top-down decision-making approach which has been the norm in urban and regional planning for decades.
Political instability can also impede the channeling of knowledge in the corridors of power. One example is Egypt’s Ministry for Urban Renewal and Informal Settlements (MURIS). Created in July 2014 with a clear mandate to improve conditions in informal urban areas, the Egyptian government disbanded it just over a year later, leaving many promising projects in limbo.
In Baltimore’s case, excellent research was no guarantee of success, as local groups – including the homeless themselves – didn’t seem to support the outcome of the mapping. Morgan State University researchers discovered that businesses, neighboring communities, and developers opposed the idea of having a permanent shelter in their area. Even the homeless people who attended a focus group said that they preferred assistance in obtaining their own private residences rather than relying on public sector housing.
In China’s case, many foreign companies who were put on the spot about the pollution they were causing seemed willing to cooperate in monitoring their Chinese factories and business partners. Wal-mart, General Electric, and Siemens all began cooperating with the Green Choice Alliance in this respect. But other corporations, including Apple, was, at least initially, skeptical.
“I think Apple probably has two faces: In America, it’s a very green friendly company, but in China, when it comes to its secret supply chain management, it’s a totally different thing,” Ma said.
The activism of Ma’s brand wasn’t always viewed with approval. Therefore, activists have to remain on their guard, making sure that they do not overstep any legal boundaries. The fact that the central government has not shut down Ma’s operations, he told Christina Larson, is due to his careful strategy to only argue for the law to be upheld.
Other activists in China have often practiced what is known as “rightful resistance” using officially-recognized ideological principles to apply pressure on officials who fail to live up to such principles, or who are reluctant to take indisputably beneficial measures (O’Brien 1996).
As Ma said, “Before we can push for higher pollution standards, we first want to have the existing regulations observed.”
Conclusion
There is ample evidence that decision-makers, and not only those in government, may be enticed to map data and information to communicate the spatial dimensions of government policy or social trends and to mobilize others to act. The future of mapping looks promising, as the practice is not only fueled by activism and new technical tools, but has the occasional backing of people in government and business. But mapping, like all information, is a political tool, and as such it is vulnerable to censoring and interference.
One has to wonder what will happen to mapping efforts when the political tide turns? What would a repressive government do if certain types of mapping, especially those illustrating questions of social injustice or skewed government decision making, become less palatable? Would the individuals involved in information gathering, research, or mapping be penalized, discouraged, shut down, or worse?
On the upside, there is also every chance that in normal or reformist political contexts, governments may wake up to the benefits of mapping. Laws related to the right of information may be strengthened and lead to closer cooperation among advocacy groups, communities, and local and central officials. There is also a chance, however slim, that government statisticians, planners, and budgeting specialists may – taking their cue from the mappers – restructure government data in a manner that better matches current needs.
The right to information movement in India, for example, begun by a small provincial NGO that made data more accessible and available to any Indian citizen and to activists, paved the way, in part, to an anti-corruption campaign that recently influenced national electoral politics.
In Egypt’s case, the TADAMUN team has been able – after much effort – to reconfigure government data into useful categories, in order to analyze the spatial dimensions of inequality and injustice in government public service provision at the neighborhood or sub-district level (shiyakha).
One of the primary goals of TADAMUN’s Planning [in] Justice project is to demonstrate the value of data analysis at shiyakha level and to collect and disseminate such information to the general public, thus enhancing the ability of decision-makers to address problems faced at local levels within the city and the likelihood that citizens will better understand government policy and socio-economic and spatial challenges.
References:
ISDF. (2010). Informal Settlement Development Facility National Plan.
Larson, Christina. 2010. “In China, a New Transparency on Government Pollution Data,” Yale Environment 360, December 20.
Loubert, Linda. 2010. “Mapping Urban Inequalities with GIS.” ArcNews Online, Spring.
MoF, 2014. Ministry of Finance. 2014/2015 national budget.
NUCA. (2015). New Urban Communities Authority. Population sizes for all new urban communities stated on website. (Link)
O’Brien, Kevin J. 1996. “Rightful Resistance.” World Politics 49: 31-55.
1.The “right to the city” is an idea that was first proposed by Henri Lefebvre in his 1968 book Le Droit à la ville. Paris: Ed. du Seuil, Collection “Points.”


Comments